04 April 2010
Global warming - reworking out the actual changes
As already discussed, I have become sanguine about the global warming information that I have been reading and hearing from the media - lots of noise and jumping up & down by all sorts of people. And perhaps, I have taken too much on trust and should have looked in more detail at the raw information from scientists rather than listened to politicians and journalists, who don't always know the detail but like the spin of a story; some of my earlier blogs specifically take the line fed to me in the media, which I am now thinking could have been a rash way to go - see for example https://steenbergs.co.uk/blog/2009/12/un-climate-change-conference-in-copenhagen/.
Hence, the next stage of my quest was to hunt down some raw data that was simple enough for me to process and see what the results came up with. That was actually harder than I thought, so while The Met Office in the UK has data linked into The Hadley Centre, I couldn't understand their data at all - there was too much and not enough explanation. I did try and contact them and an email was sent via The Met Office to The Hadley Centre, but I never got any response.
Note to UK Climate Scientists - you have got to be much more open about what you're doing as this lack of openness really increased my scepticism, and as a publicly funded body, I think you have no right to secrecy on this one. Allied to issues of leaked emails etc, you've got some serious work to do on your PR and credibility!
So, as often seems to happen in life, the USA came up trumps. I have often been very surprised by how helpful, open and progressive America can be, when at times it still sometimes is stuck in the Dark Ages (on things like good food and packaging waste and energy consumption etc). I got useful data from NASA's Goddard Institute for Space Studies Surface Temperature Analysis which is available at http://data.giss.nasa.gov/gistemp/; ironically, this data incorporates the Hadley Centre Data that I never was given when I enquired direct. I then downloaded the information which is at the bottom of the web page on "Combined land-surface air and sea-surface water temperature anomalies" and used the Global Mean Analysis. This comes with some caveats as does the alternative data which is also available on that page - "Means based on Land-surface air temperature anomalies only".
I spent a merry time copying the data from the hard copy - I am sure some whizz could have automatically downloaded this and got it all pretty in spreadsheet, but as I have said before computers really are a bit of a mystery to me. Next I sorted the data so I could represent the data graphically and I did this for monthly, seasonal and annual data. Finally, I got a ruler and pencil out and worked out some best fit lines to come up with my own views on global warming.
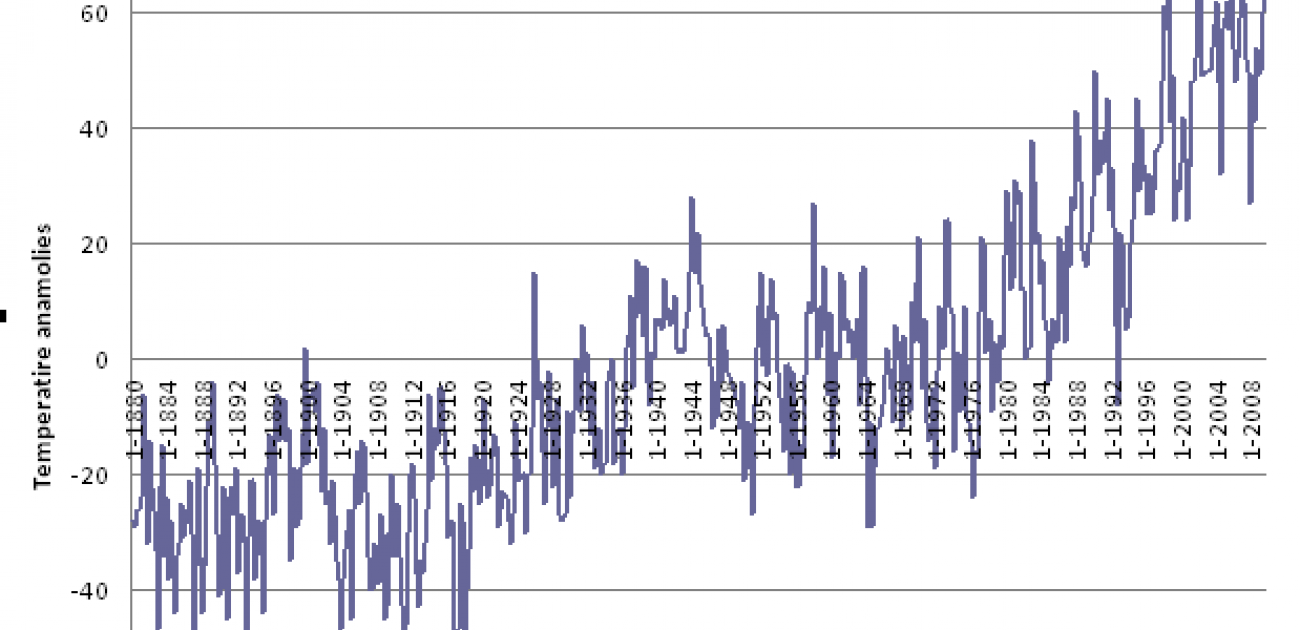
The result: yes, it does appear that global temperatures have risen over the last 100+ years, BUT (and it's a big BUT) not by as much or as quickly as all the media and political hype has been telling me, us and the world.
The data shows that global warming is running at about 0.7oC every 100 years with a maximum of about 2oC and a minimum of about 0.4oC, but it is definitely in line with my original blog that said 0.5oC – 1.8oC every 100 years. The particular data used comes with a caveat that it might be understating temperatures, however I reckon that this will be a consistent error over the period so the trend should be the same.
Well that's not the 3 - 4oC imminent global catastrophe that I had been led to believe with everyone being flooded away in a biblical onrush of melting land-ice drowning all of coastal Britain. It does not mean that I must rush off down to Jewson's to buy lots of timber and build an ark to save the planet, or at least not quite yet.
I come from eco viewpoint so I am not especially happy about my conclusions, so as I am not yet 100% with this result, I will be cross-checking the information with some specific country data if I can come by it. But I do have to say that the data came via a web site that promotes better understanding of Climate Change and is for the issue as opposed to against, so if there is any bias it will be to promoting the likelihood of global warming rather than the skeptical position - www.realclimate.org.
The graphs that I got out from the data are below (if you want better detail just email and ask):